Back to the Accelerometer
As I mentioned in my previous post I was a bit worried that my accelerometer wasn't working properly. When hooked up along with an LED matrix there were some LEDs that just wouldn't light. It seemed like was the X-axis that was giving me trouble.
Since I'd "played with it" I couldn't return it to Sparkfun, in any case it was past the 14 day limit. This is kind of a bummer because it cost me about $20 - aside from the Arduino, one of the most expensive components in my inventory.
So, I decided to create a way to test it. I figured it'd be cool to find out if there was actually a range of values that the X-axis wasn't producing. To do this would involve having the Arduino read the 3 axis and output the values through the serial port. I'd then have to write some software on the other side to read the values and display them in a way that made sense.

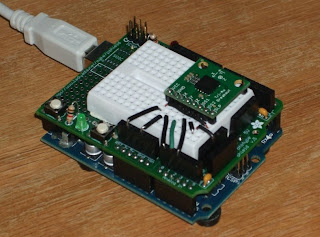
First I hooked everything up on the Arduino and
proto-sheild (see image). Then I proceeded to write a very simple sketch to read the accelerometer and output what it reads through the serial port.
Since I'd already done some serial communication between the Arduino and a .NET 2.0 application, this wasn't all that hard. The sketch reads all three axis in the main loop an then immediately outputs those values through serial as decimal values separated by commas. Each value is sent via Serial.print with the final one sent with a Serial.println. The println statement slaps on a '\n' to the final value separating it from the next set of values that are sent. The code for all this is as follows:
/*
* TripleAxisAccelerometer4.pde
*
* This test involves sending the analog values out through
* the serial port. These values will be read by a .NET app
* and displayed on a WinForm. The goal here is to determine
* whether the x-axis is as messed up as I think it is.
*/

// axis analog pins
int xPin = 0;
int yPin = 1;
int zPin = 2;

// values from those pins
int xVal = 0;
int yVal = 0;
int zVal = 0;

// other working variable schtuff
int mid = 337;
int set = 0;


/*
* The "run once" setup method
*/
void setup()
{
// set up to communication with serial
Serial.begin(9600);

// set axis/analog pins to input
pinMode(xPin, INPUT);
pinMode(yPin, INPUT);
pinMode(zPin, INPUT);
}

/*
* Main processing method
*/
void loop()
{
// fetch value from various analog
xVal = analogRead(xPin);
yVal = analogRead(yPin);
zVal = analogRead(zPin);

// show us
Serial.print(xVal, DEC);
Serial.print(",");
Serial.print(yVal, DEC);
Serial.print(",");
Serial.println(zVal, DEC);
}
The next part was to write a .NET app to read what the Arduino produces. This was a little harder. I'd sent info to the Arduino, but never read anything. The .NET framework provides some easy to use libraries and methods to do this, including one method that reads in an entire line from the com port.
Initially I just displayed the values to text boxes - just to prove that I could. Then I included high and low values, and then some progress bars. This was also useful in finding out something I didn't really know. The accelerometer actually produces values from 0 to 693. I found this by using the low and high trackers - these just take whatever value comes off of the Arduino for a given axis and compares to a value in memory. If the new value is lower or higher, it's kept
. After many replacements you see what the limit is.
This all went swimmingly until I decided to try and paint the values to the screen using the .NET System.Drawing library. There are a lot of examples on the web showing how to paint lines or polygons, but annoyingly enough there weren't many that showed how to paint just a single pixel. I eventually found one and that's what's included in the example below in the "Draw" method. Also note: I've only included the code-behind of the main form. This contains most of what anyone would need to reproduce this since I'm assuming any .NET developer could easily infer the rest on a simple WinForm app.
using System;
using System.Collections.Generic;
using System.ComponentModel;
using System.Configuration;
using System.Data;
using System.Drawing;
using System.Drawing.Drawing2D;
using System.Drawing.Imaging;
using System.IO.Ports;
using System.Text;
using System.Windows.Forms;

namespace AccelerometerTest
{
public partial class MainForm : Form
{
 #region Members

 private SerialPort arduino = null;

 private int valX = 0, valY = 0, valZ = 0;
 private int lowX = 1023, lowY = 1023, lowZ = 1023;
 private int highX = 0, highY = 0, highZ = 0;

 private bool readSerial = false;

 KnownColor[] allColors = null;

 #endregion Members

 #region Constructor

 public MainForm()
 {
     InitializeComponent();
 }

 #endregion Constructor

 #region Events

 ///
 /// Setup of main form - and Arduino communications
 ///
 ///
 ///
 private void MainForm_Load(object sender, EventArgs e)
 {
     // fetch port and rate
     string comPort = ConfigurationManager.AppSettings["ComPort"];
     int baudRate = int.Parse(ConfigurationManager.AppSettings["BaudRate"]);

     // connect to the Arduino
     arduino = new SerialPort(comPort, baudRate);
     arduino.ReadTimeout = 3000;
     arduino.WriteTimeout = 3000;
     arduino.Open();

     System.Array colorsArray = Enum.GetValues(typeof(KnownColor));
     allColors = new KnownColor[colorsArray.Length];
 }

 protected override void OnPaint(PaintEventArgs e)
 {
     base.OnPaint(e);
 }

 ///
 /// Shut down the app.
 ///
 ///
 ///
 private void btnExit_Click(object sender, EventArgs e)
 {
     Application.Exit();
 }


 ///
 /// Initiate - or stop - the process of reading the Arduino.
 ///
 ///
 ///
 private void btnStart_Click(object sender, EventArgs e)
 {
     if (btnStart.Text == "Start")
     {
         btnStart.Text = "Stop";
         readSerial = true;
         ClearForm();
         ReadArduino();
     }
     else
     {
         btnStart.Text = "Start";
         readSerial = false;
     }
 }

 #endregion Events

 #region Supporting

 ///
 /// Does the work of fetching serial data from the Arduino
 /// and displaying it - in various ways - to the form.
 ///
 private void ReadArduino()
 {
     // working variables
     char[] delim = { ',' };
     string line = "";
     string[] axis = null;
     int tmpX = -1, tmpY = -1, tmpZ = -1;

     // while flagged to read
     while (readSerial)
     {
         // fetch one line of serial data from the Arduino
         line = arduino.ReadLine();

         // remove the return at the end of the line
         if (line.LastIndexOf("\r") > -1)
         {
             line = line.Substring(0, line.Length - 1);
         }

         // if there was nothing read, just skip this iteration
         if (string.IsNullOrEmpty(line.Trim())) { continue; }

         // implicit else - split the line to an array of strings
         axis = line.Split(delim);

         // if we got an array
         if (axis != null && axis.Length == 3)
         {
             // update the values if possible
             if (!int.TryParse(axis[0], out tmpX)) { tmpX = -1; }
             if (!int.TryParse(axis[1], out tmpY)) { tmpY = -1; }
             if (!int.TryParse(axis[2], out tmpZ)) { tmpZ = -1; }

             // update the form with these values
             UpdateForm(tmpX, tmpY, tmpZ);
         }

         // pump the windows message loop
         Application.DoEvents();
     }
 }


 ///
 /// Clear everything we've painted
 ///
 private void ClearForm()
 {
     // reset buckets
     valX = 0;
     valY = 0;
     valZ = 0;
     lowX = 1023;
     lowY = 1023;
     lowZ = 1023;
     highX = 0;
     highY = 0;
     highZ = 0;

     // reset texts
     txtXaxis.Text = valX + "";
     txtYaxis.Text = valY + "";
     txtZaxis.Text = valZ + "";

     txtXlow.Text = lowX + "";
     txtYlow.Text = lowY + "";
     txtZlow.Text = lowZ + "";

     txtXhigh.Text = highX + "";
     txtYhigh.Text = highY + "";
     txtZhigh.Text = highZ + "";

     // reset progress bars
     pgXaxis.Value = valX;
     pgYaxis.Value = valY;
     pgZaxis.Value = valZ;

     // clear the image
     RectangleF rectFToFill =
         new RectangleF(0, 0, pbTrack.Width, pbTrack.Height);
     SolidBrush brush = new SolidBrush(Color.White);
     Graphics gfx = pbTrack.CreateGraphics();
     gfx.FillRectangles(brush, new RectangleF[] { rectFToFill });
     brush.Dispose();
 }


 ///
 /// Update bounds text
 ///
 ///
 ///
 ///
 private void UpdateForm(int tmpX, int tmpY, int tmpZ)
 {
     // check if our values changed or are even valid
     valX = (tmpX > -1 && tmpX != valX) ? tmpX : valX;
     valY = (tmpY > -1 && tmpY != valY) ? tmpY : valY;
     valZ = (tmpZ > -1 && tmpZ != valZ) ? tmpZ : valZ;

     Draw(valX, valY, valZ);

     // update the core value text boxes
     txtXaxis.Text = valX + "";
     txtYaxis.Text = valY + "";
     txtZaxis.Text = valZ + "";

     // first update the progress bars
     pgXaxis.Value = valX;
     pgYaxis.Value = valY;
     pgZaxis.Value = valZ;

     // set lower bound values
     lowX = (valX < lowy =" (valY" lowz =" (valZ" text =" lowX" text =" lowY" text =" lowZ" highx =" (valX"> highX) ? valX : highX;
     highY = (valY > highY) ? valY : highY;
     highZ = (valZ > highZ) ? valZ : highZ;

     // set upper bound text
     txtXhigh.Text = highX + "";
     txtYhigh.Text = highY + "";
     txtZhigh.Text = highZ + "";
 }


 ///
 /// Draws a single point
 ///
 ///
 ///
 ///
 private void Draw(int xVal, int yVal, int zVal)
 {
     int idx = (zVal * 174) / 693;
     // Pen pen = new Pen(Color.Black, 1);
     Pen pen = new Pen(Color.FromKnownColor(allColors[idx]), 1);
     Graphics gfx = pbTrack.CreateGraphics();
     Point[] points = { new Point(xVal, yVal) };

     // Create a 1 x 1 bitmap and set the color
     Bitmap pt = new Bitmap(1, 1);
     pt.SetPixel(0, 0, Color.Black);

     // Draw bitmap on Graphics surface
     gfx.DrawImageUnscaled(pt, xVal, yVal);

     //gfx.DrawPolygon(pen, points);
     //gfx.DrawRectangle(pen, new Rectangle(points[0], new Size(1, 1)));
     //gfx.DrawRectangle(pen, new Rectangle(xVal, yVal, 1, 1));
     //formGraphics.DrawLine(myPen, xVal, yVal, xVal, yVal);

     pen.Dispose();
     gfx.Dispose();
 }

 #endregion Supporting

 #region Properties

 #endregion Properties
}
}
When the app is run and the painting starts its actually kind of interesting how it works. The dots are sort of sprayed all over the place as the accelerometer is moved. I'm not sure if this is just an artifact of how sensitive the accelerometer is or if it's due to noise coming in on the Arduino's analog ports. Either way it looks a bit like an airbrush. In this first go I stuck with painting black dots on a white canvas and only used the X and Y axis to do the painting. I'd like to eventually use the Z axis to drive color, but I'd have to decide how to assign the 0 to 693 or so values to colors somehow.
Doing this kind of "painting" again revealed something I didn't know. Handling the accelerometer without actually shaking it hard shows some median limits to how far it senses. Regular force, or 1 g, is about halfway through the range of values. That is if you tip it on its side so one axis is fully down - like X or Y - the value it displays is about halfway of middle. By tipping the Arduino/proto-shield fully on it side and then slowly rotating it the app paints a rough circle. It's kind of cool, actually.

One bit of work still remains, though: to pinpoint whether there are any values on the X axis (or the others, for that mater) that don't show. Based on what I am seeing, I don't think so. I suspect my problem with the LED matrix not showing some values is due to bad coding in the sketch somewhere.
I have made a recent purchase from SparkFun that will result in more posts. Among the items I've purchase is an LED matrix with a serial interface. This is the same LED matrix I already have, except the folks in Boulder have added a daughter board on the back that handles the job of lighting the LEDs based on signals sent serially. So I don't have to use up nearly as many pins on the Arduino to accomplish the same thing. In fact, with this I can certainly do more. But again, I'll leave that for a later post.


Comments
Post a Comment